History always repeats itself when it comes to market bubbles. If you have already retired or are planning on retiring before the year 2030, this chapter could be a cautionary history lesson to take immediate action to protect your retirement savings. Imagine going back in time to 1998 and you were planning to retire in 2000. Your 401k and IRA balances have doubled in the last decade and you now have accumulated a nest egg that is sufficient to replace your monthly paycheck in your retirement. You plan to take out 5% of your account value and never touch the principal based on the advice from your stockbroker. If you had access to data that warned you about an investment bubble, would you have acted on it? What if you had access to a retirement account that could have protected you from this very bubble and provided you with lifetime income no matter what the stock market did? Would you have done something differently? Fast forward to present day.
What is a bubble? Is it possible to identify stock market bubbles before they occur with any kind of certainty? If you could be warned of this oncoming bubble and subsequent market correction, what would you do to protect your retirement savings?
Professor Robert Shiller is widely regarded as one of the most influential economists in th e world and a recipient of the Nobel Memorial Prize in Economics in 2013 for his empirical analysis of asset prices. Shiller created a stock market valuation indicator (price to earnings ratio P/E”) designed to help forecast long term equity market returns.
Before reading further it is vital to grasp a basic understanding of what a P/E Ratio is. The “Price to Earnings” Ratio or “P/E Ratio” is the stock price divided by one years’ worth of earnings per share (profit). In perhaps easier to understand terms, it can be considered the number of years it would take for the company to make back your original investment
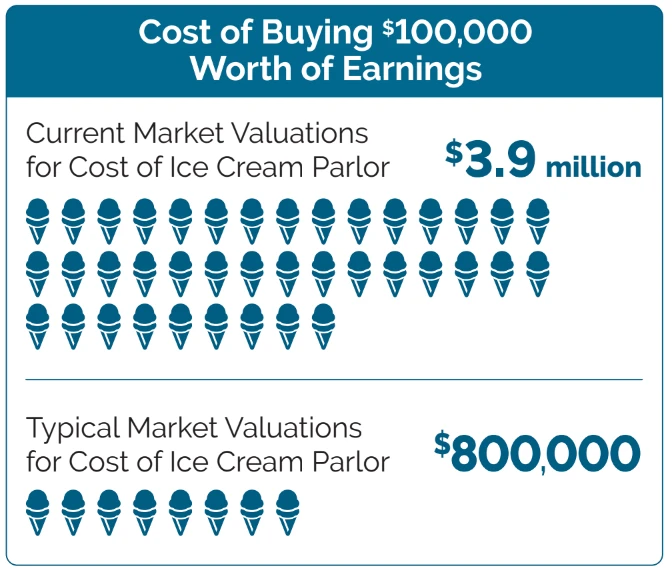
As an example, assume you wanted to purchase an ice cream parlor shop that has been around for 10 years. The owner is willing to sell the business for $800,000. How would an investor know if this price was reasonable and how long it would take to recoup the cost of the purchase? One way would be to look at the historical profit or earnings of the ice cream parlor. If the profit last year was $100,000, it would have a (P/E) Price to Earnings Ratio of 8. How did we arrive at the number 8? Well, the sale price is $800,000 and we simply divided that by one years’ worth of earnings, in this case $100,000, thus arriving at a P/E ratio of 8. In 8 years, you would recoup your cost for purchasing the ice cream parlor. If we were to use todays extremely high valuations, this same ice cream parlor would sell for $3,900,000. It would take you 39 years to recoup your money in todays extremely high market valuations. These ratios are very important to gauge how expensive the stock market is, especially in broad terms when looking at the largest 500 companies in America, it also can help identify bubbles.

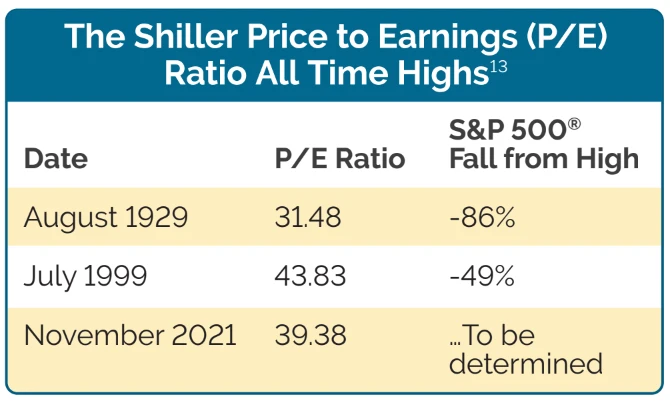
A highly respected valuation gauge developed by Yale economist and Nobel Prize laureate Robert Shiller hit a mark showing that the S&P 500® is now pricier than in 96% of all quarters over the past 141 years. Put differently, large company stocks have been this expensive only 4% of the time in the recorded history of stock markets. Shockingly the only other two times this gauge was this high was in 1929 and in 1999. What the stock markets did following these high marks is in the table below.


Delve into the world of smart retirement planning with our comprehensive guide, "Guarantee Your Retirement". This book is your key to understanding the complexities of retirement risks and learning effective strategies to secure a stable, lifelong income.
Click below to claim your free copy now and embark on the journey to a secure and prosperous retirement!
Get My Free BookCan’t find the answer you’re looking for? Please chat to our friendly team.
Get in touchUnlocking the Secrets of Annuity Investments and Strategic Retirement Planning for Long-term Wealth